[Home <www.channld.com/software.html>]
Frequency Response Measurements

The revised ("Second Version," ca. May, 2001) iMic has the newer, Philips UDA1325H/104 USB audio codec chip (formerly used the UDA1325H/106).
The easiest way to tell the different iMic versions apart is from the output coupling capacitors in the revised model, indicated by the red circles in the photo above. The board also has the legend "Rev 2" etched into the ground plane, although as far as we know, it is the first revision.
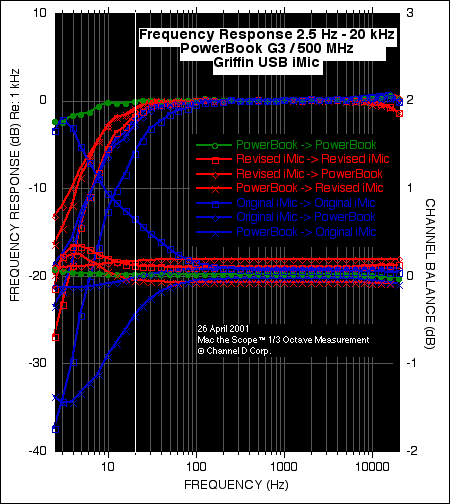
The most significant difference rests in an extension of the low frequency response. A minor difference is the 2 dB high frequency roll-off in the revised iMic input section (note that the iMic -> iMic and PowerBook -> iMic curves are the same at high frequencies, and the iMic -> PowerBook curve is the same as the PowerBook duplex curve at high frequencies).
Another revision of the iMic ("Third Version," ca. November, 2001): the board layout is the same as the version marked "Revised" above. Our sample has a different (beige/yellow colored, like those circled - instead of black with silver band) 47 microfarad capacitor (below the Philips codec chip). The 4-pin connector at the lower left corner of the photo isn't installed. The board is marked Rev 3. The difference is a slightly extended low frequency response, compared to the Revised iMic -> Revised iMic measurement (-1 dB instead of -2 dB at 20 Hz).
 |
|
The frequency response measurement shown is for Channel 1. All curve amplitudes were matched at 1 kHz, which represents 0 dB. The white fiducial was placed at 20 Hz; infrasonic frequencies lie to the left of the line. The curve legends indicate the way the signal was connected. For example, iMic -> PowerBook indicates that the iMic was used to generate (output) the test signal (D/A), and the PowerBook (input) was used to measure the signal (A/D) The Channel 2 response can be determined from the channel balance measurement, which represents the difference between the two channels. For instance, a 1 dB dip in the channel balance curve indicates that the response of Channel 2 is down by 1 dB at that frequency, compared to Channel 1. If the response of Channel 1 exactly matched Channel 2, the channel balance curve would be a flat line with an amplitude of 0 dB. The channel balance measurement deviation for the Original iMic reflects differences in input and output impedance or frequency response between the two iMic channels. The duplex and PowerBook -> iMic results are contradictory, but there are several possible scenarios that could cause this to happen, depending on the particular channel impedances, frequency responses and component tolerances. The exact cause could be determined with a circuit schematic. The increased low-frequency roll-off in duplex mode (both iMic versions) reflects the combined roll-off of the input and output channels. |
Measurement conditions:
Note: these measurements may be replicated with the free, demo version of Mac the Scope (the session timeout limit provides ample time for making the measurement).
Here are distortion and noise floor measurements for the above products.
Here are links to some other measurements.
[Home <www.channld.com/software.html>]
Copyright 2001 Channel D Corporation