![]()
[Support] [Product Info] [Downloads] [Ordering] [Home <www.channld.com/software.html>]
Distortion and Noise Floor Measurements of Macintosh Built-in Audio
Last updated 07 February 2002
About the measurements:
Important: when comparing these measurements to those of other computer sound hardware, you need to ask the following questions:
The answers to the questions for the measurements below are: 1, the computer, 2, the computer.
Here, the distortion and noise are the sum of that from the computer's input and output hardware. Elsewhere, you may have seen measurements of other sound hardware that omits the contribution of one or the other. Generally, and provided that the measurements show excellent combined performance of the audio input and output hardware (as is the case here), such information only would be of practical use to the hardware manufacturer.
Quiet sound hardware can unmask lower-level distortion products. The same (or worse) distortion may be present with noisier hardware, but masked by the noise. For a fair comparison, the distortion of two "cards" should be compared at signal levels at or above the noise floor of the noisiest card.
The measurements shown below were signal averaged with the CONT averaging function of Mac the Scope (until the traces stopped changing visibly, typically several hundred averages - - a few seconds at the data rate of the measurement) to unmask distortion components hidden by a single-shot measurement. A single-shot measurement would show a "noisy" noise floor curve that would be within a few dB of the smoother, averaged curve. This is illustrated below. The single-shot measurement is ambiguous, because it fails to resolve some of the distortion products.
The analysis of the 1 kHz sound file (calculated and saved to disk with Waavebox™), below, was done strictly in the digital domain, to show what happens when the quantization, timing jitter, nonlinearity, shot and Johnson noise from the D/A and A/D converters and signal circuitry from the "outside world" is eliminated (and to show the quality of Waavebox dithered test waveforms).
Note that the measurements used a 990.527 Hz signal, rather than exactly 1 kHz. This provides a more accurate picture of the performance of the hardware, because it eliminates measurement artifacts (such as scallop loss, that can mask distortion products with amplitudes within a few dB of the noise floor) caused by applying a windowing function. FFT windowing is necessary when dealing with waveform frequencies needing a non - power of two number of data points (to support an even number of waveform zero crossings) within the analysis frame. However, measurements made at exactly 1 kHz give comparable results (see below).
990.527 = 46 (cycles) * 44100 (Hz, the sample rate) / 2048 (points). (These "frame locked" frequencies automatically are selected if the Digital Lock feature of Waavebox is enabled. 2048 represents the number of waveform points, and is the same as the Waavebox LATENCY setting.)
See our Technical FAQs document, included with the Mac the Scope software download, for more information about the precision (and accuracy) of the frequencies generated by Waavebox.

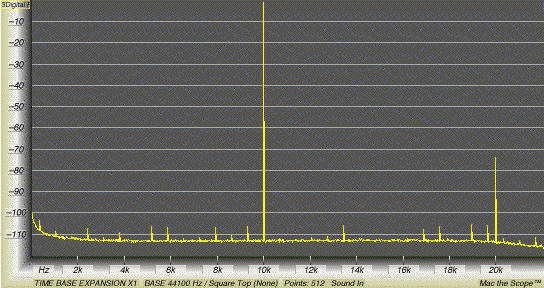
(above) PowerBook G3 500 MHz, input level at digital full scale (nominal 10 kHz), 512 point FFT. Signal averaged to reveal low-level distortion components and true noise floor. MacOS 9.0.4.

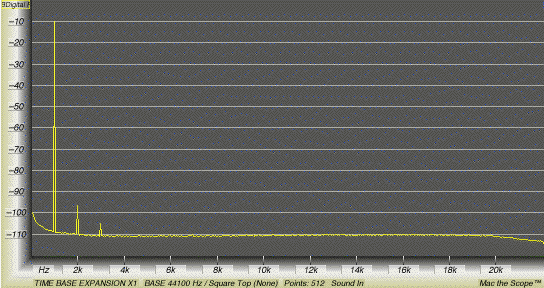
(above) PowerBook G3 500 MHz, input level at -10 dB vs. digital full scale (nominal 1 kHz: 990.5 Hz), 512 point FFT. Signal averaged to reveal low-level distortion components and true noise floor. MacOS 9.0.4.
(above) PowerBook G3 500 MHz, input level at -9 dB vs. digital full scale (nominal 1 kHz: 990.5 Hz), 512 point FFT. Single shot measurement (no averaging). MacOS 9.0.4.
Specific measurements (images shown at 76% of actual size) for other machines are shown below. Lower THD and more negative (SINAD + Amplitude) are better.
All tests were run with the same computer simultaneously generating the test signal (except where noted).
(above) Waavebox 1 kHz AIFF sound file, dithered, 2048 samples
(above) 333 MHz iMac G3
(above) 233 MHz Mac G3 Desktop
(above) 117 MHz PowerBook 5300ce
(above) 80 MHz Power Macintosh 7100/80AV
(above) 80 MHz Power Macintosh 7100/80AV, test signal from PowerBook
[Back to Measurement Index Page]
[Return to Channel D home page <http://www.channld.com/software.html>]